With the Photometry Service, you generate automated diagrams from your IES and LDT files
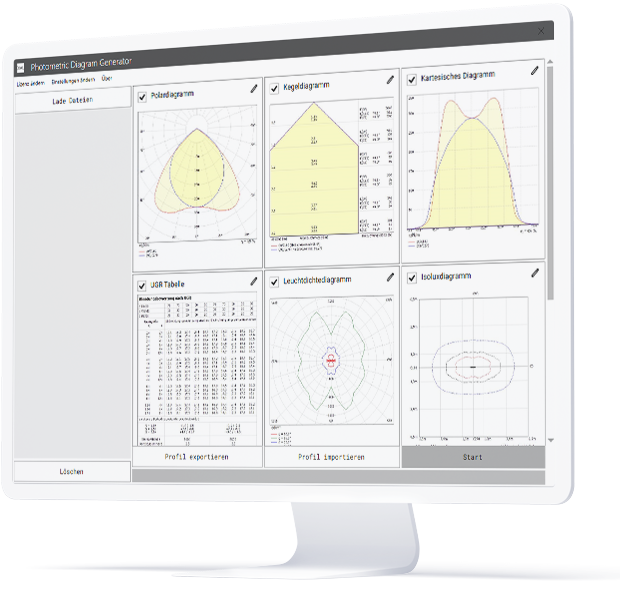
The smart infrastructure solution.
Our interface integrates into your website, PIM, or internal systems and automatically generates diagrams from your IES and LDT files. Ready to use immediately for your website, catalog, or internal systems – without any manual work.
System-integrated | Automated | Brand-compliant
HOW DOES THE PROCESS WORK?
Automated diagrams in just three steps
1. Integrate the interface
We provide the interface and support the integration into your website, PIM, or internal systems.
2. Provide data
Your existing IES and LDT files form the basis for the diagram generation.
3. Generate diagrams
The diagrams are generated automatically or on demand and delivered instantly.
SCOPE OF SERVICES
Selectable diagram types
The diagram types are modular and selectable. You define the scope and receive exactly the diagrams that are relevant for your portfolio.
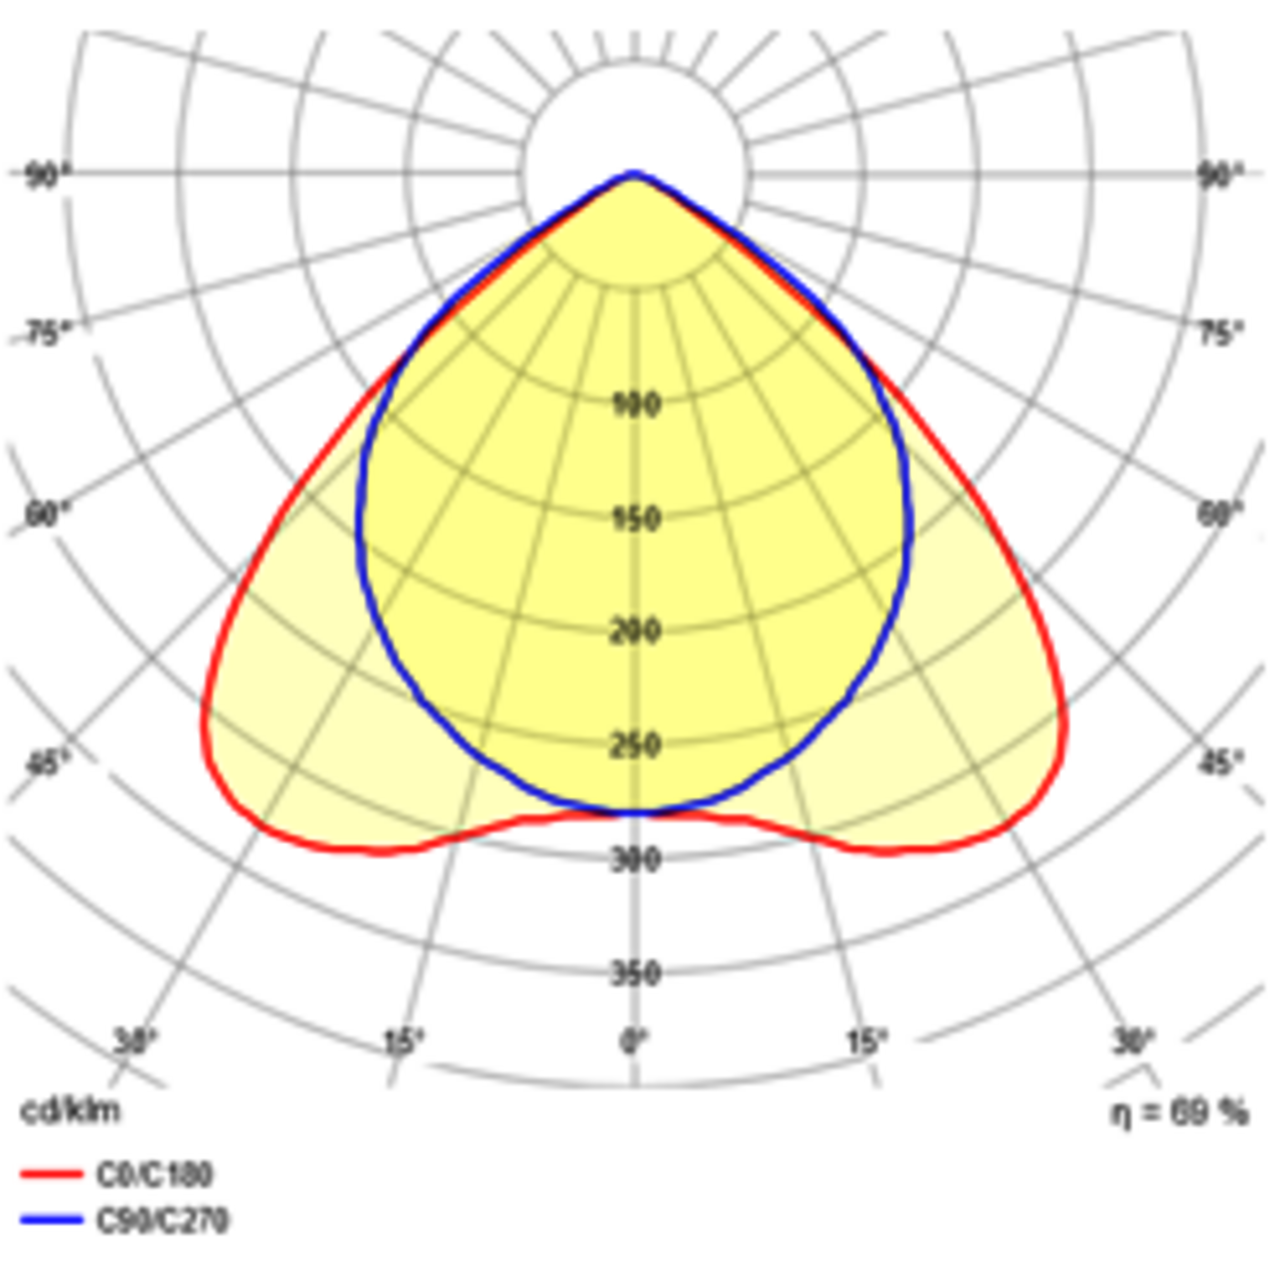
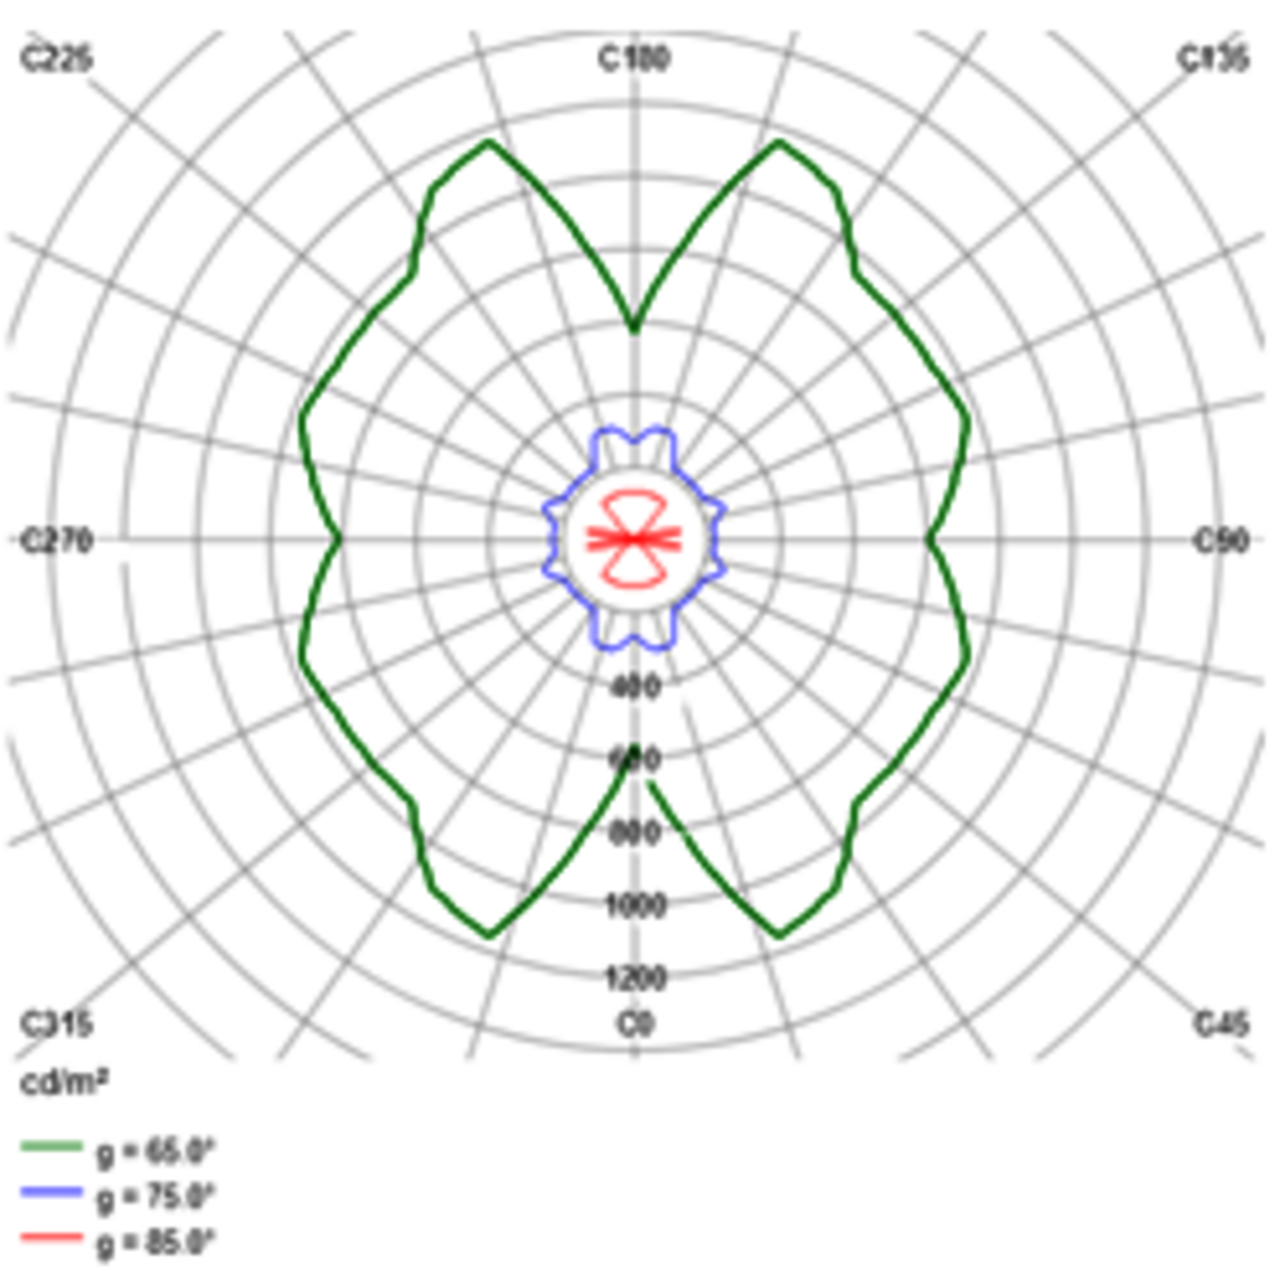
Luminous intensity
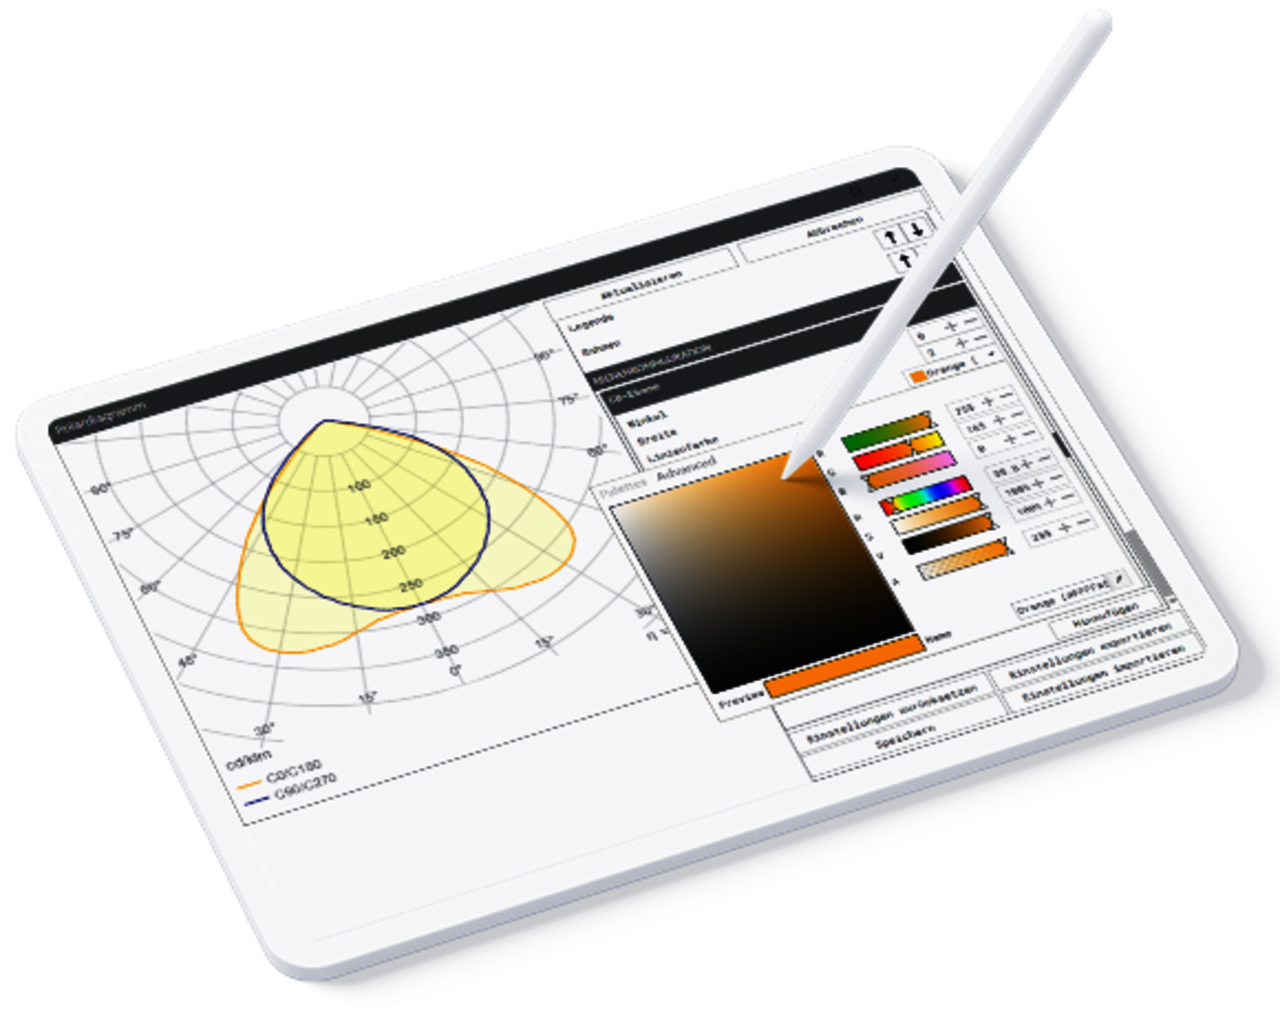
Polar diagram
Shows the luminous intensity distribution to evaluate light direction and beam characteristics.
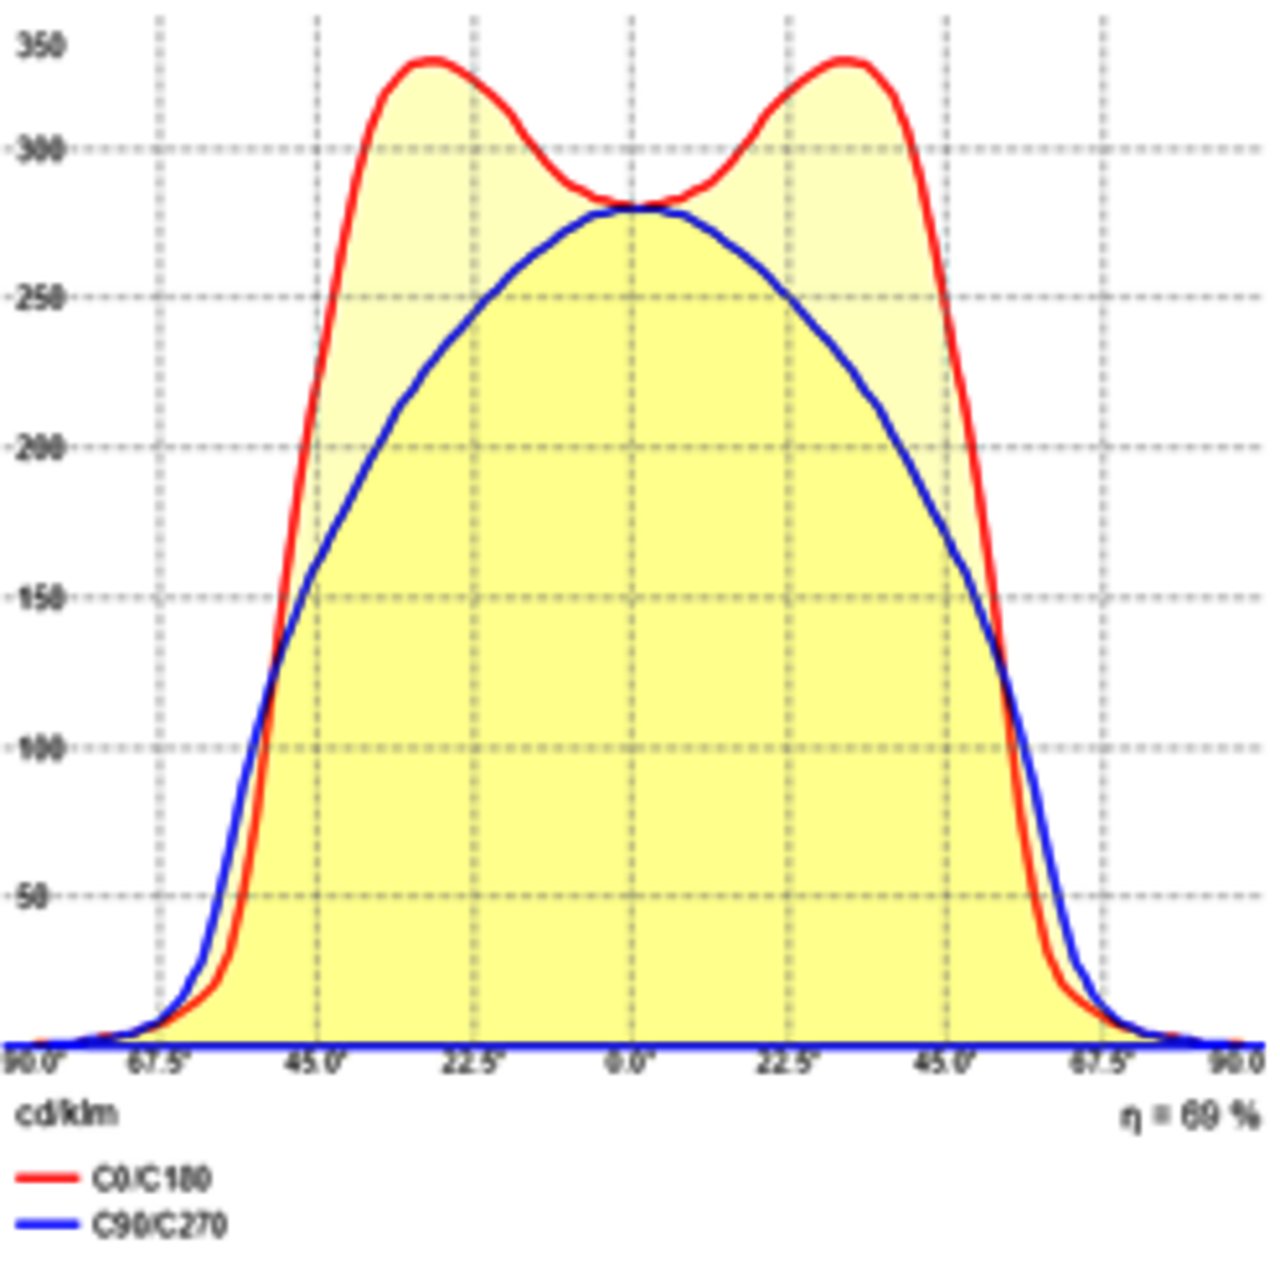
Luminous intensity
Cartesian diagram
Displays luminous intensity in Cartesian coordinates to analyze beam characteristics.
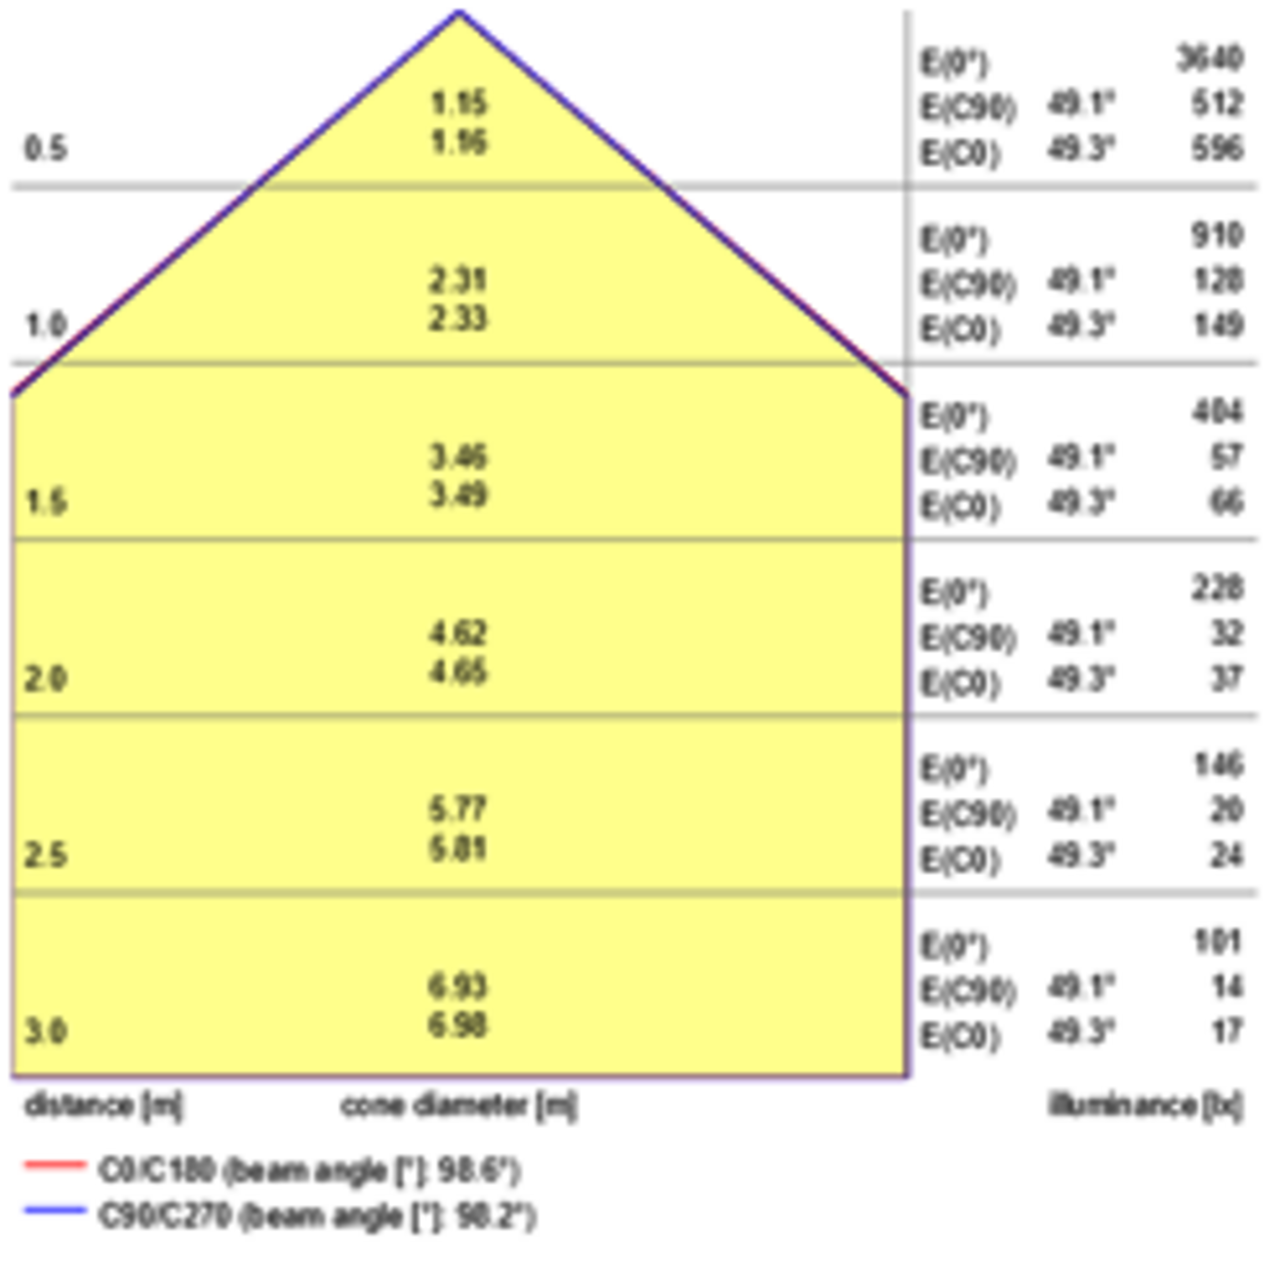
Spatial effect
Cone diagram
Visualizes the light cone in space to assess beam angle and light distribution.
Luminance
Luminance diagram
Shows luminance distribution to evaluate brightness, visual comfort, and glare risk.
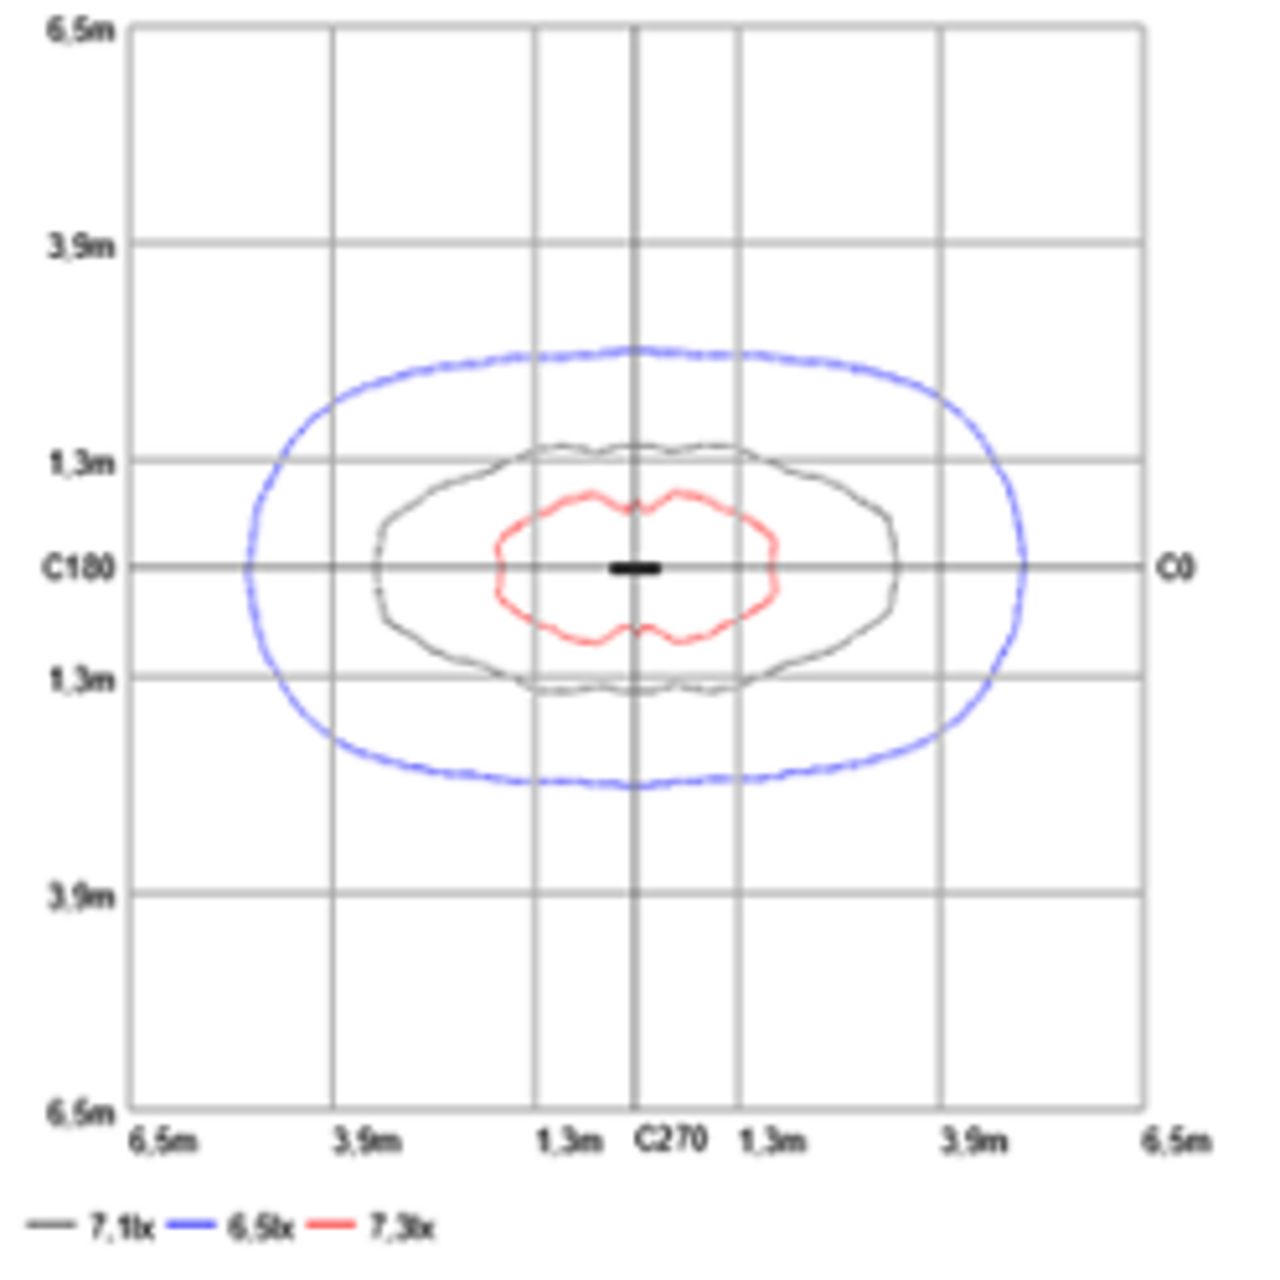
Illuminance
Isolux diagram
Shows lines of equal illuminance to evaluate light distribution on surfaces.
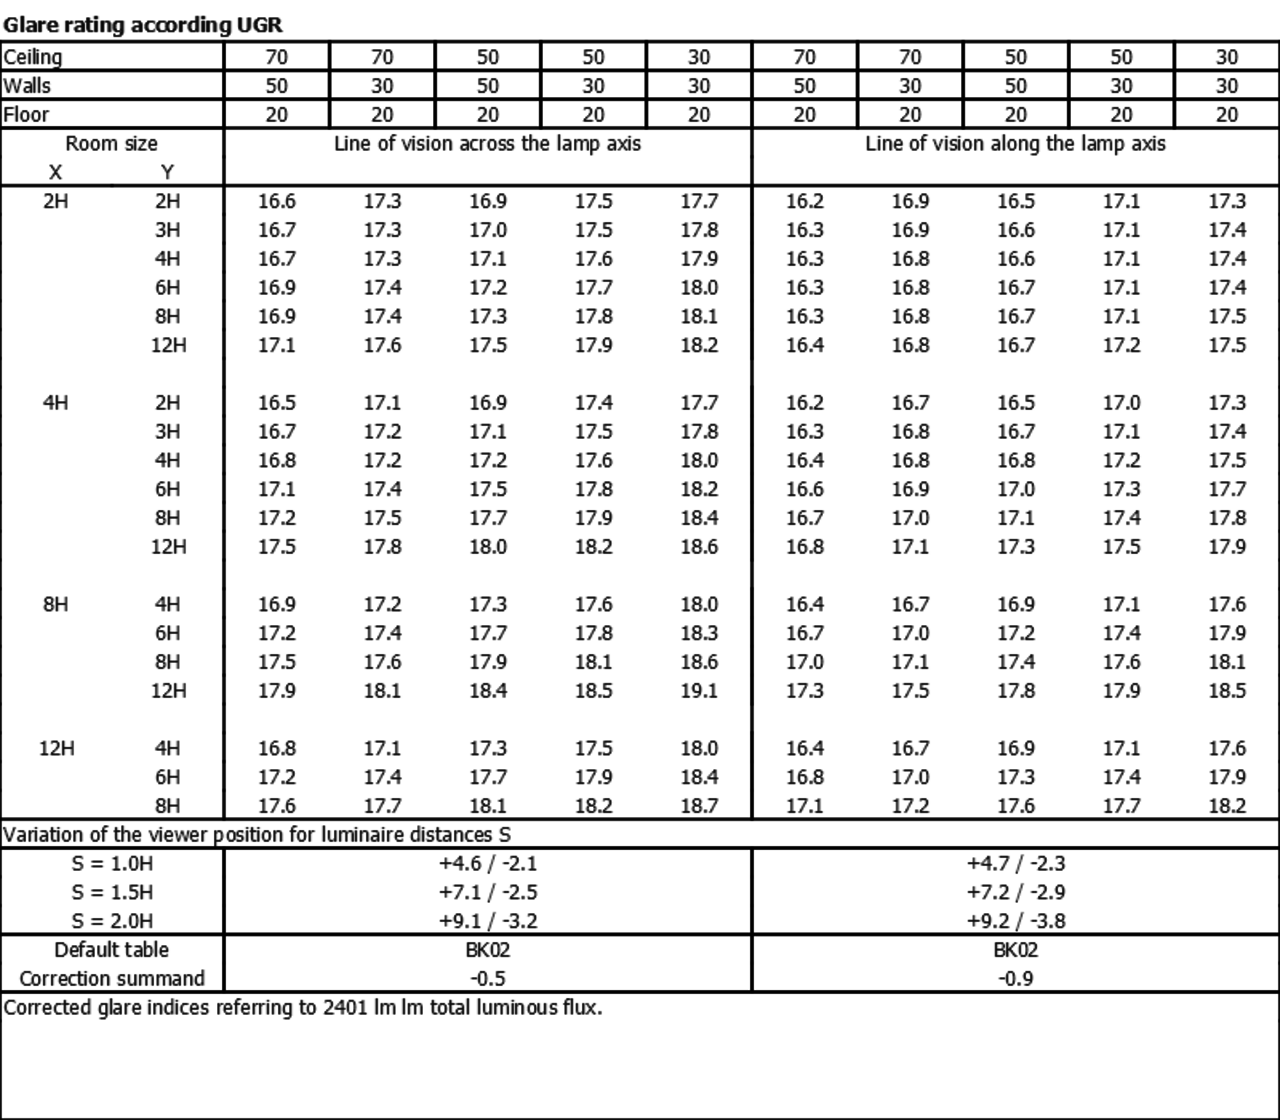
Glare
UGR table
Determines UGR values to evaluate glare in different room situations and lighting designs.
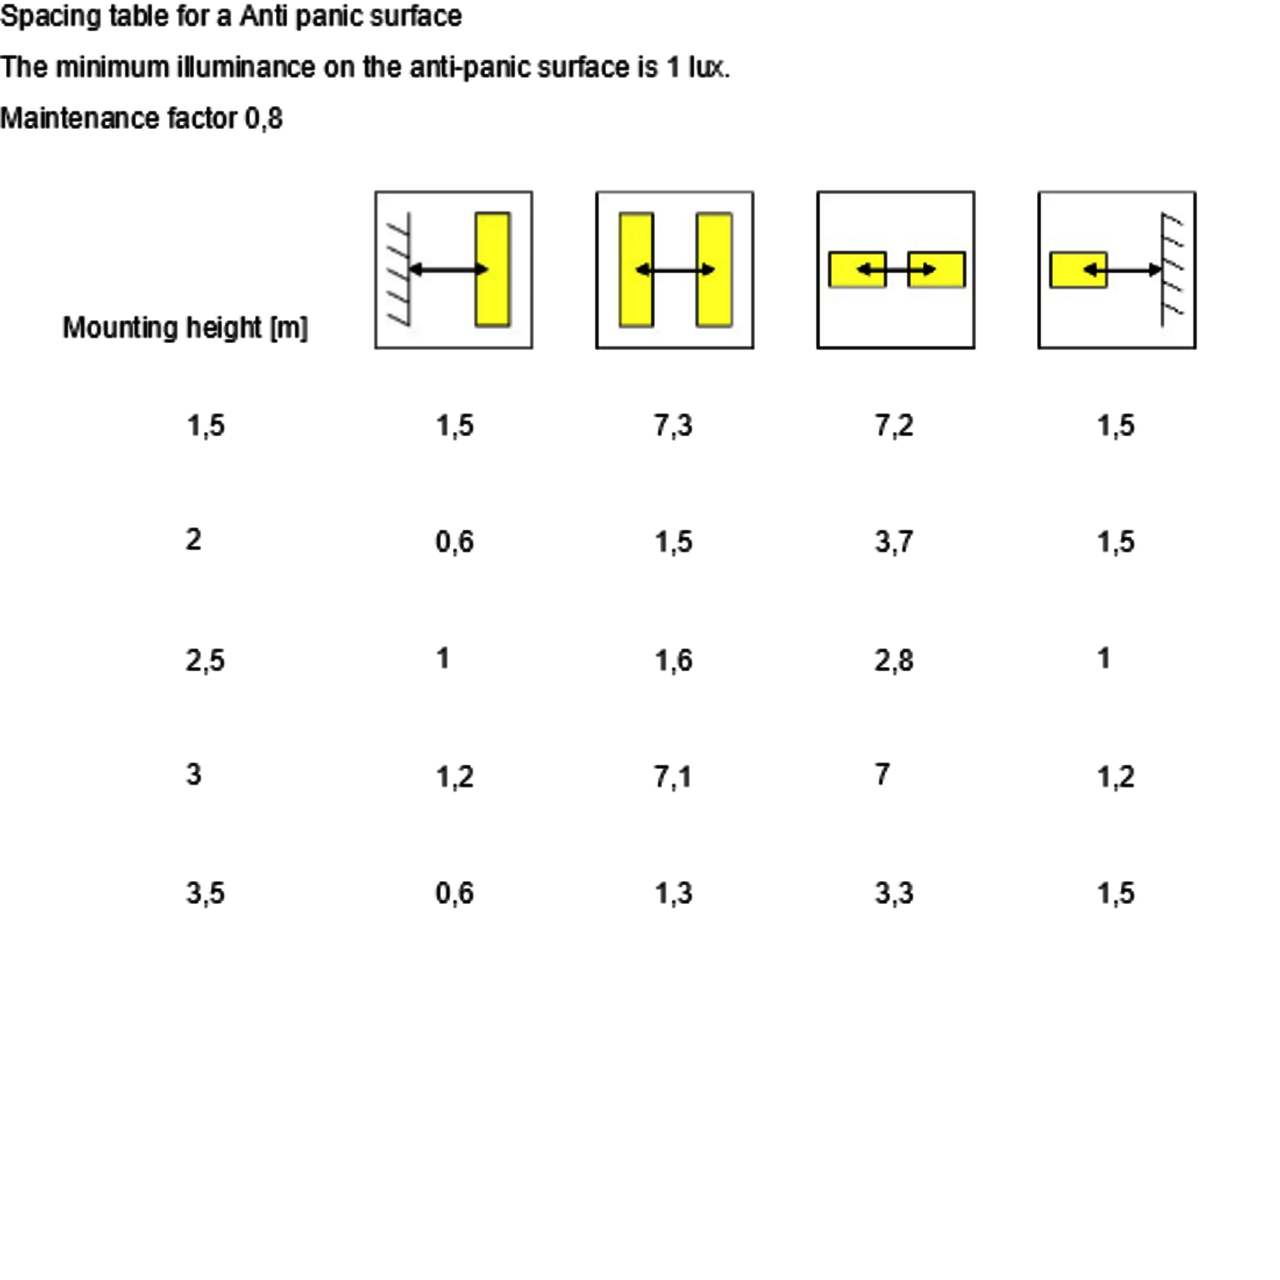
Emergency lighting
Emergency lighting spacing
Calculates luminaire spacing for emergency lighting in accordance with relevant standards.
YOUR LOOK & FEEL
Customize your diagrams
Define the design. Apply it consistently.
You define colors, lines, fonts, and sizes centrally. All diagrams are automatically generated in your corporate design – ensuring a consistent appearance that matches your brand.
OUTPUT & USAGE
Formats for every use case
The diagrams are automatically exported in the appropriate format. Ideal for websites, catalogs, PIM, or internal systems.
.SVG .PNG .JPG .BMP .Excel
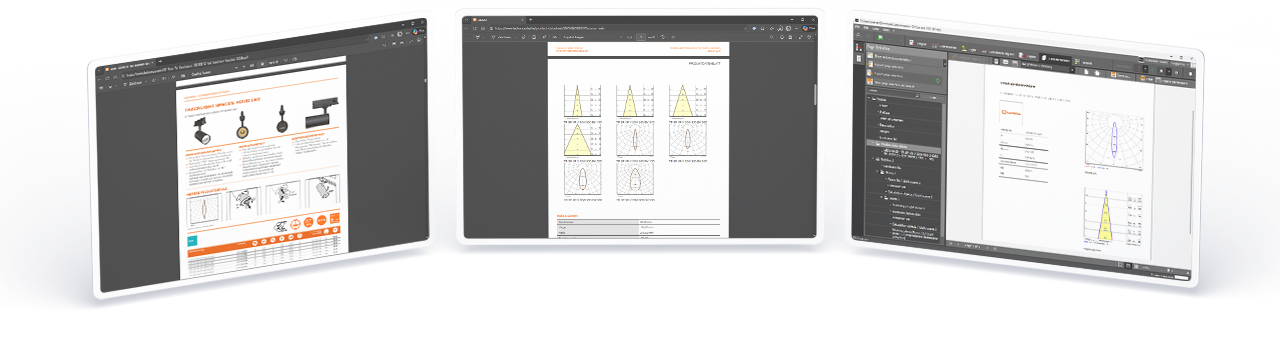
Website Catalogs (Digital & Print) Product data sheets PIM systems Internal sales & product systems
BENEFITS
Why the Photometry Service pays off
Less effort. More impact.
The Photometry Service automates the creation of your diagrams. Always up to date. In the right format. In your design.
Work more efficiently
Automatic diagram generation saves time, reduces maintenance effort, and relieves your teams.
Connect systems
Directly integrable into your website, PIM, and internal systems – for consistent product data.
Strengthen your brand
Your diagrams appear everywhere in your corporate design – consistent across all channels.
Get started now
Generate photometric diagrams fully automatically from now on. Together we discuss how the Photometry Service can be integrated into your systems – tailored to your requirements.
Your contact person
Jan von Huene
huene(at)dial.de
+49 2351 5674 315